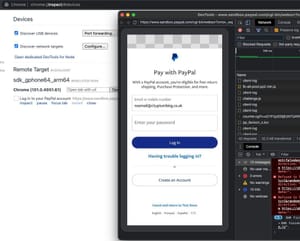
Effective debugging of WebView and CustomTabs is crucial for the development of high-quality mobile applications. This guide outlines a straightforward approach to debug these components along with network requests and errors.
Introduction: A concise overview of the necessity of debugging for smooth app functionality.
Step 1: Start by enabling debugging on your smartphone or emulator to prepare it for further inspection.
Step 2: Access Chrome DevTools on your desktop through chrome://inspect/#devices to connect with your mobile device, facilitating a powerful debugging environment.
Step 3: Identify your device's WebView on the inspection page to proceed with the debugging process.
Step 4: With DevTools, debug web content effectively, monitoring network requests, performance, and real-time device screen activity.
Conclusion: By following these streamlined steps, developers can significantly improve their app's performance and user experience.


